
A quarter of a million customers see their CO2 savings each week
1 At the Till
The customer facing display shows the CO2 savings on every donated item purchased.
When not processing a sale, the screen saver shows the shop’s weekly landfill and CO2 savings that week.
2 On the App

Total weekly Landfill & CO2 savings from sales of donated items for all your charity shops on the app’s Green tile

Gift Aid donors can see their personal CO2 savings from the sale of their donated items in the Awards tile. When you earn an award it illuminates to reveal an animation.
3 Green Report
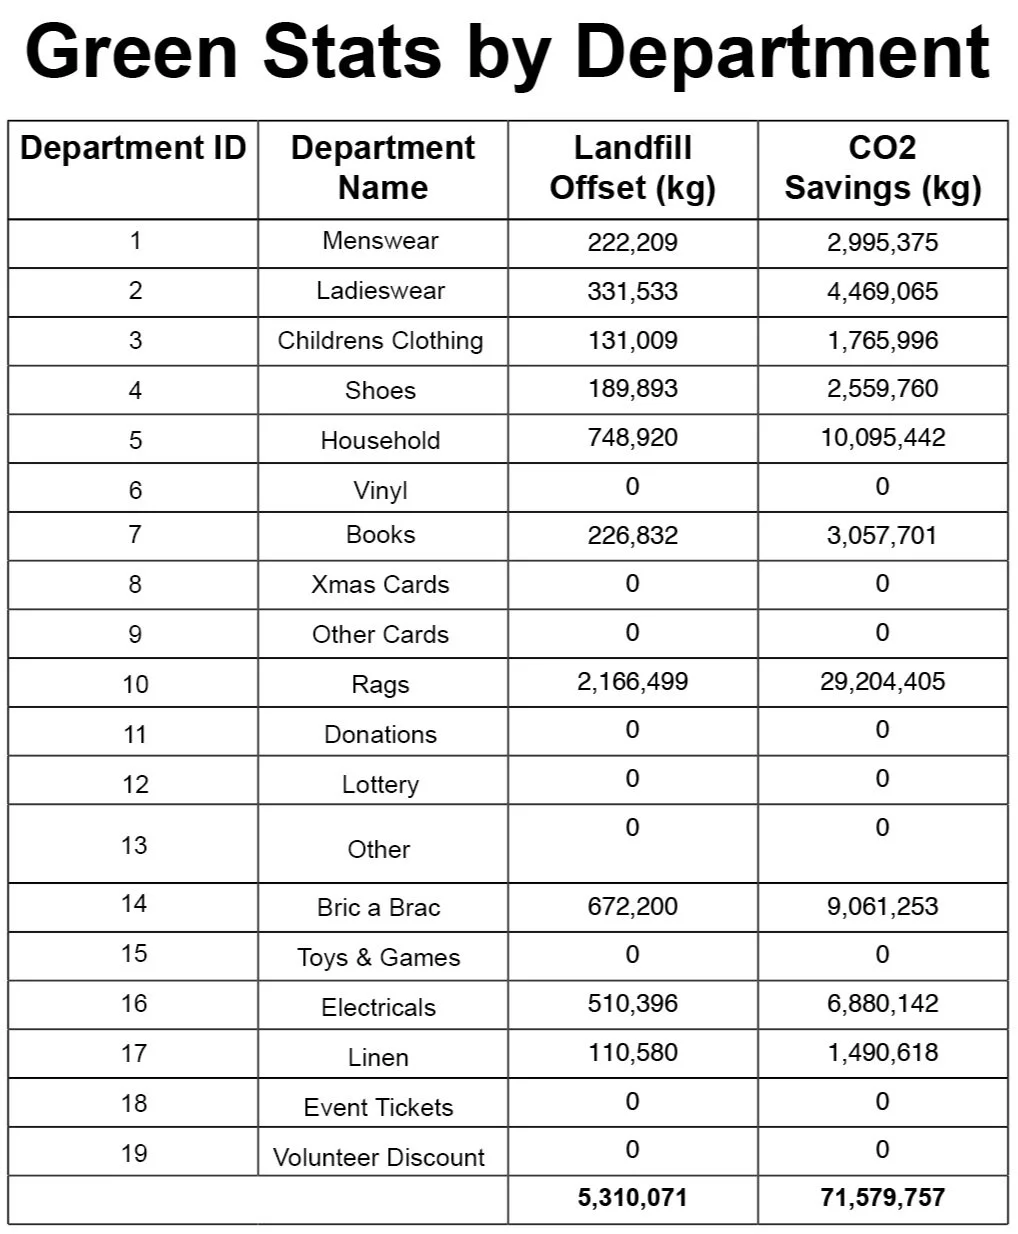
Our Green Stats Report show your charity’s total landfill and CO2 savings. You can view each shop department’s savings by area, division or total shops.
4 CRA Website
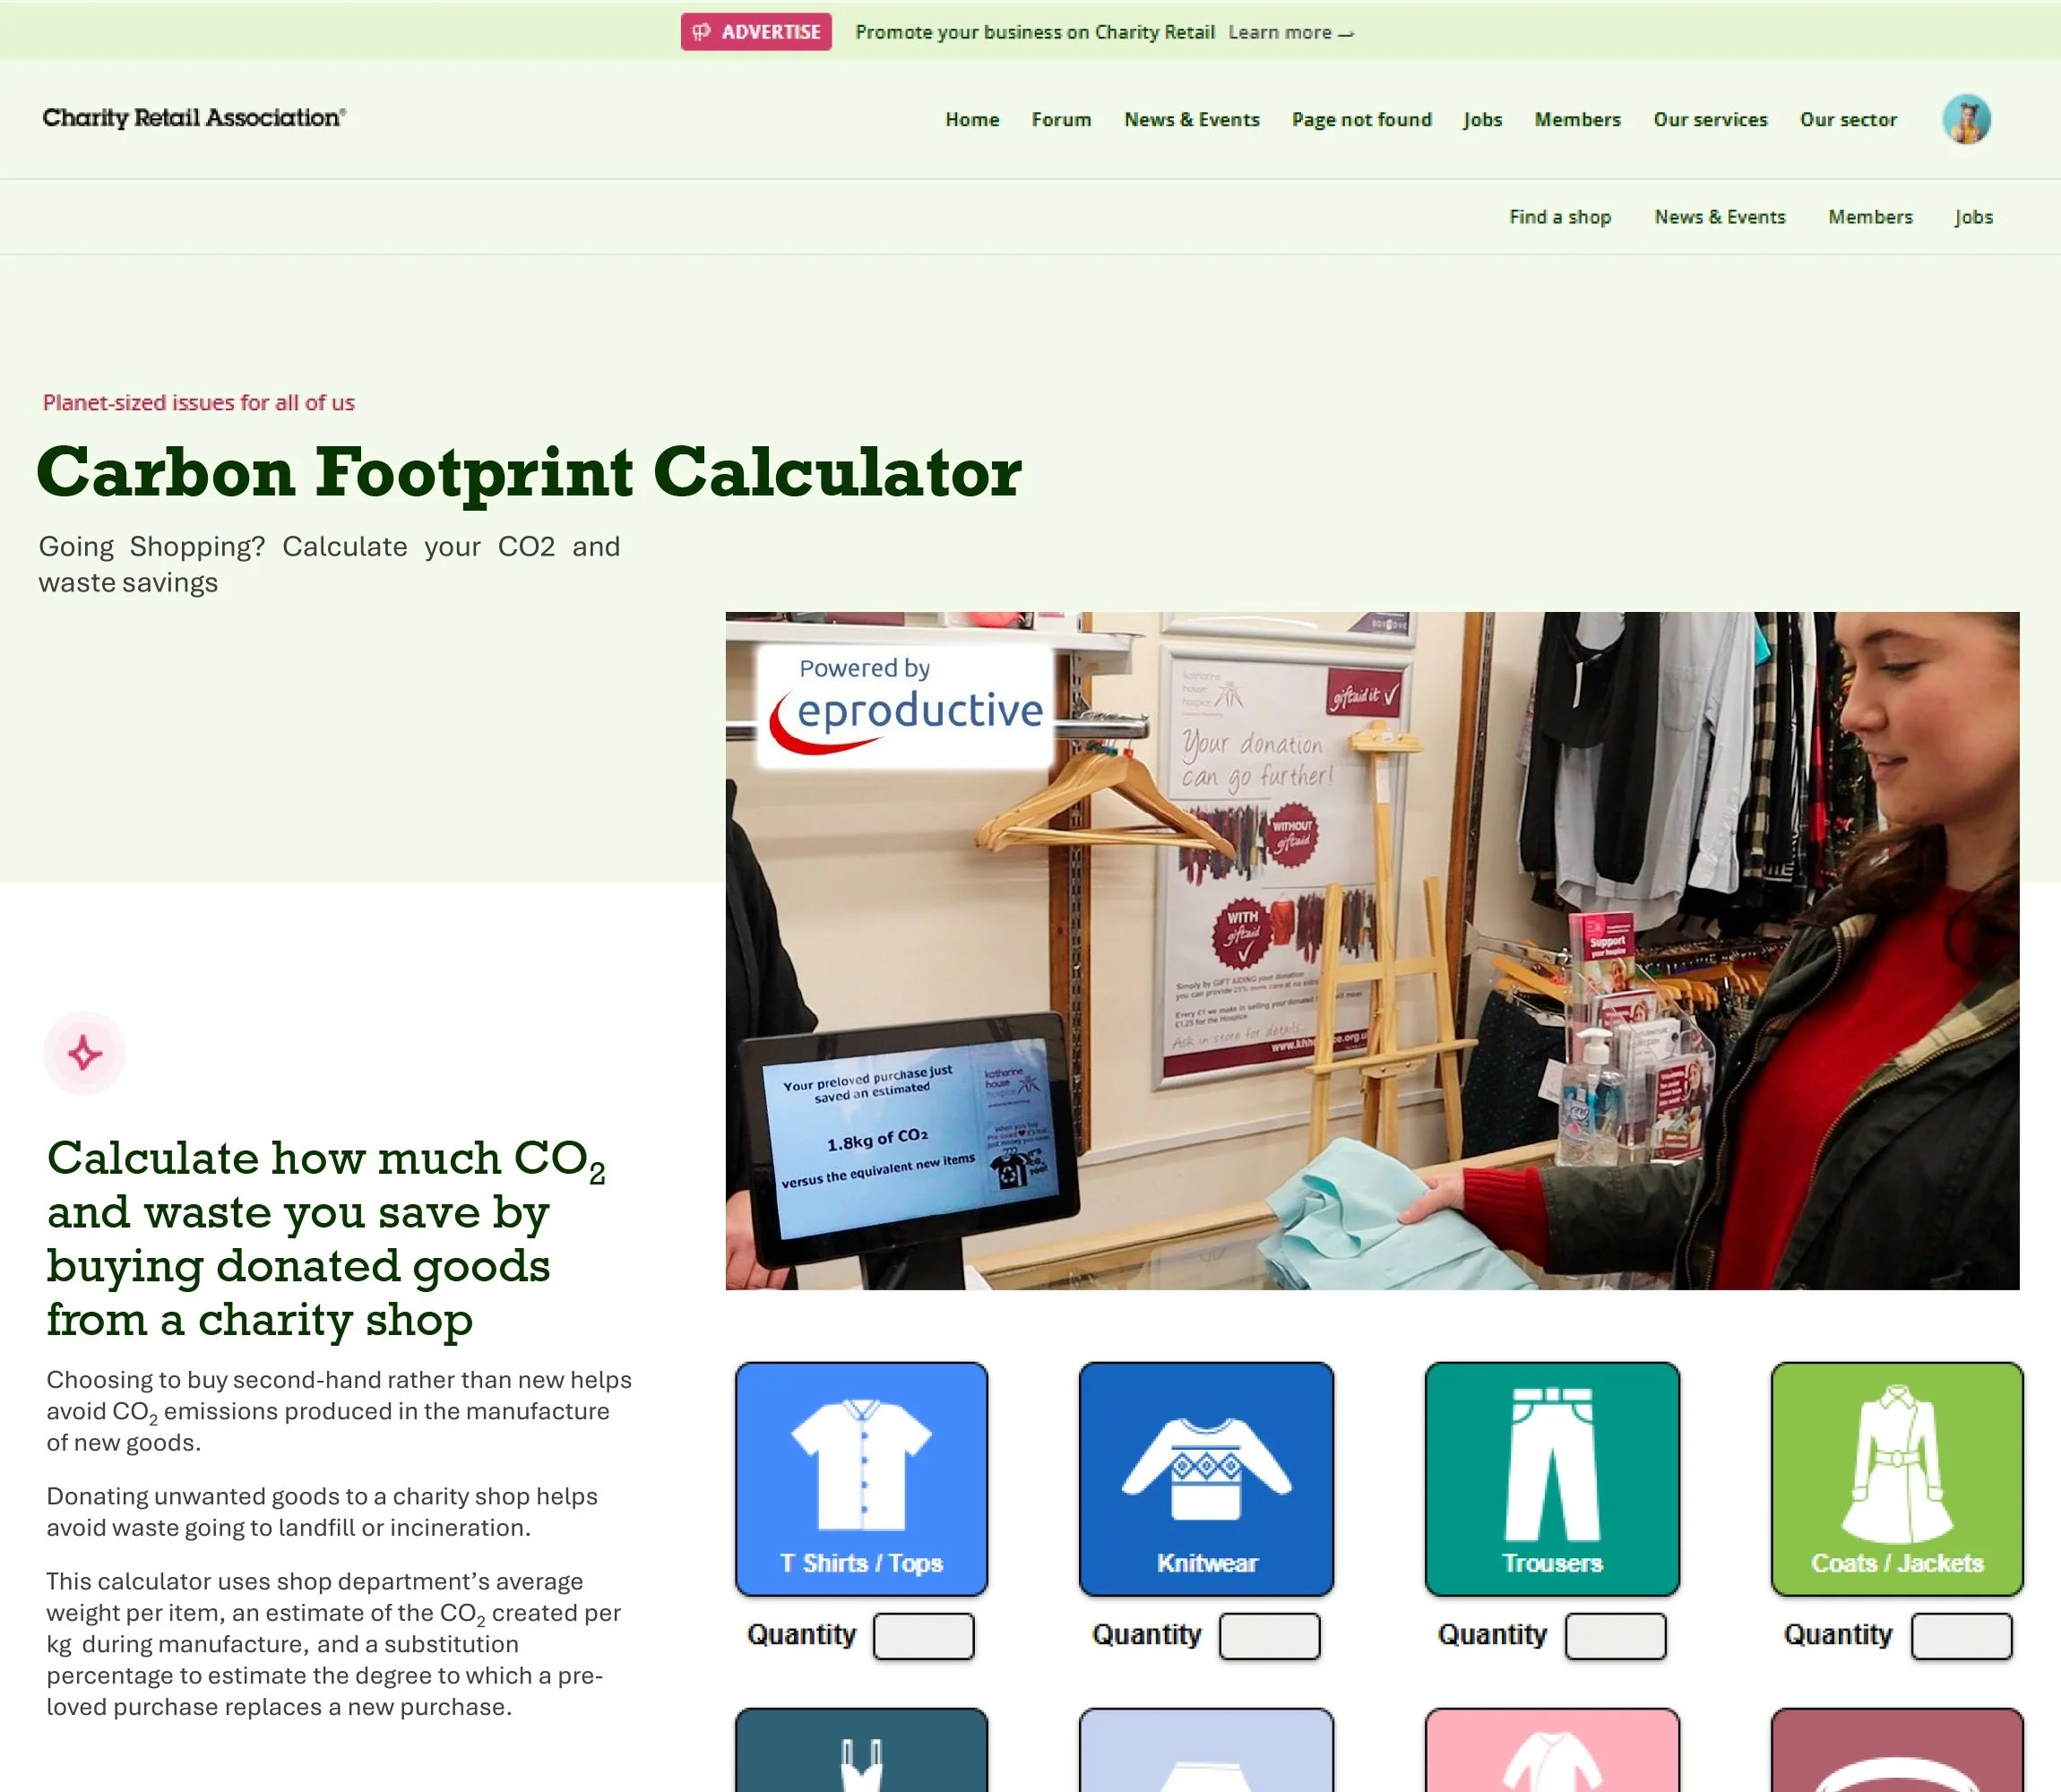
Our Carbon Footprint Calculator, on the Charity Retail Association website, shows shoppers how much Landfill & CO2 pre-loved shopping can save - 10 ladies coats saves as much CO2 as a flight from London to Paris!
What do charity retailers think?
“Being able to tell a customer how much CO2 they’ve just saved by buying a donated item rather than new is really effective. It’s a very direct way to communicate the environmental benefits of charity shops.”
Simon Dodd, Retail General Manager
Katharine House Hospice
Stafford, 2023

“We’re really excited to be rolling out CO2 on the CDU across all 264 shops. Customers see that every time they purchase a donated item they’re helping the environment.”
Nick Smith, Retail Director, Age UK, 2024

The majority of our charity clients now have CO2 savings displayed on their customer display units, (CDUs). We’re reaching over 250,000 customers every week, and that number increases every time we roll out CO2 on the CDU to another charity.
External Links


Click here to learn more about Katharine House Hospice - the first UK charity to show sustainability savings at the till.
